ASSESSING FOREST SOIL DISTURBANCE THROUGH BIOGENIC GAS FLUXES
A Thesis Submitted to the Graduate Faculty of the University of Georgia
in Partial Fulfillment of Requirements for the Degree Master of Science
by Cornelius J Dulohery III, 1993
EXCERPTS
"Biogenic gas fluxes are composite indicators of soil condition that provide a relatively new way of viewing and analyzing soil disturbance."
"Some investigators regard CO2 evolution as representative of virtually all metabolic activity in the soil."
'Nitrous oxide and methane absorb infrared radiation and contribute to the natural containment of heat in the Earth's atmosphere. While N2O and CH4 concentrations in the atmosphere are 3 orders of magnitude lower than that of C02, they absorb infrared radiation much more strongly and their contributions to "global warming potential" are disproportionately large. (Lashof and Ahuja, 1990; Rhode 1990; Figure 4)'
"The present study will contribute to the scant database on sources and sinks of CO2, CH4, and N2O."
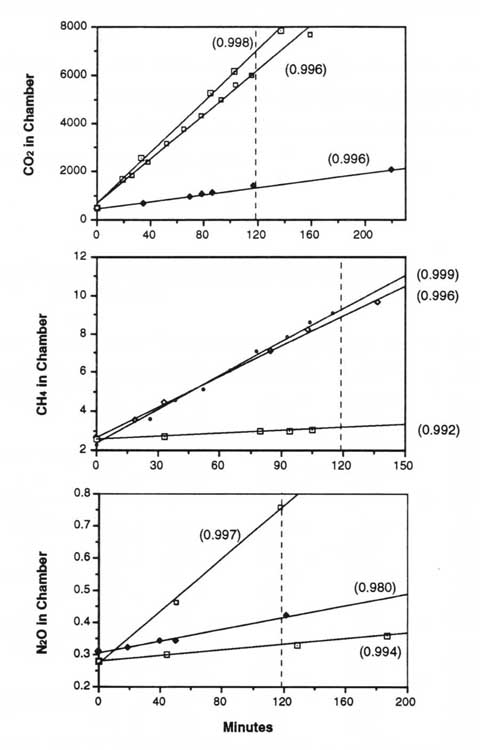
"A constant flux rate across the soil surface is desirable, as it indicates that effects sometimes associated with chambers (such as soil warming or decreased diffusion in the chamber headspace) either did not occur or did not affect the flux rate.... Evolution of all gases was linear throughout the study period."
"In an exponential regression that included all measurements from reference microsites in the study, temperature accounted for fully 85% of variation in soil respiration. Factors other than temperature became limiting with increasing severity of disturbance."
"The average N2:N2O-N
of active samples in laboratory incubations was 4.1. (Figure 39), suggesting that measurement of N2O alone greatly underestimated gaseous N loss.""Residual soil
damage from wet weather logging persisted into the establishment phase of the subsequent rotation, despite mitigation by bedding and fertilization."GRAPH EXAMPLES
Figure 8. [above] Typical examples of gas evolution in static chambers, showing linear rates of evolution. Some tests extended beyond the usual sampling period of 120 minutes (dashed line). R2 values shown in parentheses. [Indicates that chambers performed as expected with no evidence of negative feedback during the typical 2-hour sampling period.]
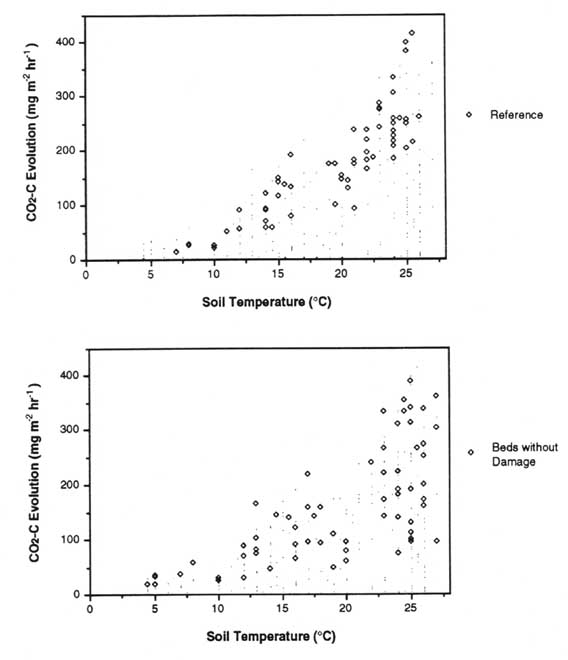
Figure 22. [above] Carbon dioxide evolution vs. temperature for all microsite measurements over the entire study period, with individual microsite types highlighted. Each microsite type is represented by 64 Points.

Figure 24. [above] Exponential regressions of carbon dioxide vs. temperature for four microsite types. Temperature accounts for 85% of the variation in carbon-dioxide evolution in the reference areas over the course of the study period. Reference areas define the upper limit of soil respiration. Sources of variation other than temperature are apparent in the bedded areas with and without previous damage...
TABLE EXAMPLES
Table 18. [below] Percent difference in variables in previously damaged beds compared with previously undamaged beds. [These are the residual effects of harvest damage.]
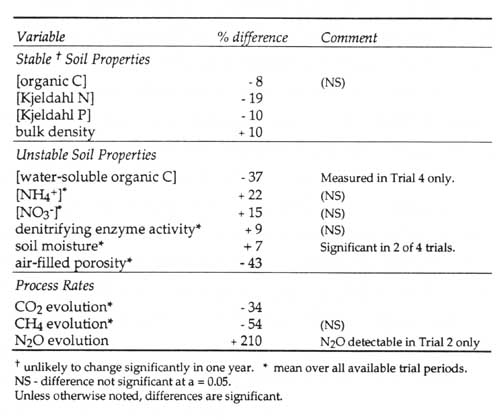
Table 1.9. Percent difference in variables in bed microsites compared with reference microsites. [These are the effects of tillage.]

SUPPLEMENTAL
Items not in original thesis...
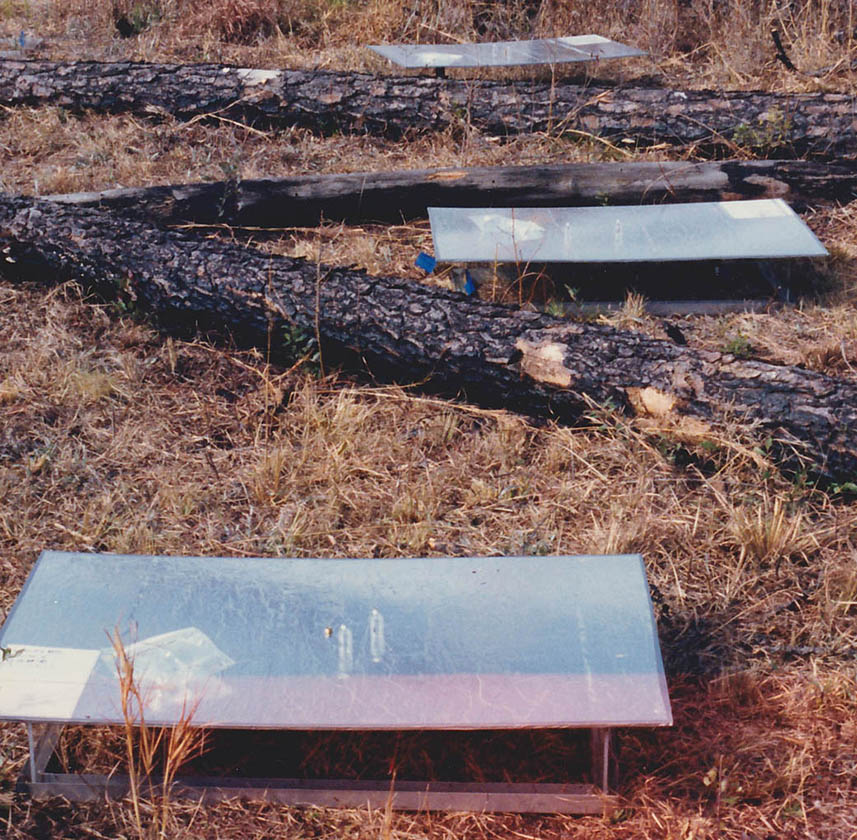
Supplemental photo 1. Gas flux chambers in situ on reference plots, Francis Marion National Forest.
Contact archivist@histbase.com